「Table-related commands in STATA」の版間の差分
ナビゲーションに移動
検索に移動
Vaccipedia.admin (トーク | 投稿記録) |
Vaccipedia.admin (トーク | 投稿記録) |
||
| (同じ利用者による、間の16版が非表示) | |||
| 137行目: | 137行目: | ||
|- | |- | ||
!table | !table | ||
| − | |[[file:table_SES.jpg]] | + | |'''table SES''' |
| + | [[file:table_SES.jpg]] | ||
|rowspan="2"|Both reports frequency<br> but '''tabulate''' is more detailed | |rowspan="2"|Both reports frequency<br> but '''tabulate''' is more detailed | ||
|- | |- | ||
!tabulate | !tabulate | ||
| − | |[[file:tabulate_SES.jpg]] | + | |'''tabulate SES''' |
| + | [[file:tabulate_SES.jpg]] | ||
|- | |- | ||
!tabstat | !tabstat | ||
| − | |[[file:tabstat_SES.jpg]] | + | |'''tabstat SES''' |
| + | [[file:tabstat_SES.jpg]] | ||
|rowspan="2"|Both reports mean<br> but '''summarize''' is more detailed | |rowspan="2"|Both reports mean<br> but '''summarize''' is more detailed | ||
|- | |- | ||
!summarize | !summarize | ||
| − | |[[file:summarize_SES.jpg]] | + | |'''summarize SES''' |
| + | [[file:summarize_SES.jpg]] | ||
|} | |} | ||
| 160行目: | 164行目: | ||
|- | |- | ||
!tabstat | !tabstat | ||
| − | |[[file:tabstat_sex_data1_SES.jpg]] | + | |'''tabstat sex data1 SES''' |
| + | [[file:tabstat_sex_data1_SES.jpg]] | ||
|Reports mean in row (transverse) direction | |Reports mean in row (transverse) direction | ||
|- | |- | ||
!summarize | !summarize | ||
| − | |[[file:summarize_sex_data1_SES.jpg]] | + | |'''summarize sex data1 SES''' |
| + | [[file:summarize_sex_data1_SES.jpg]] | ||
|Reports more details in column (longitudinal) direction | |Reports more details in column (longitudinal) direction | ||
|} | |} | ||
| 173行目: | 179行目: | ||
|- | |- | ||
!table | !table | ||
| − | |[[file:table_sex_factorA.jpg]] | + | |'''table sex factorA''' |
| + | [[file:table_sex_factorA.jpg]] | ||
|rowspan="2"|Both creates the same table<br> but '''tabulate''' is better visualized | |rowspan="2"|Both creates the same table<br> but '''tabulate''' is better visualized | ||
|- | |- | ||
!tabulate | !tabulate | ||
| − | |[[file:tabulate_sex_factorA.jpg]] | + | |'''tabulate sex factorA''' |
| + | [[file:tabulate_sex_factorA.jpg]] | ||
|- | |- | ||
!tabstat | !tabstat | ||
| − | |[[file:tabstat_factorA_by(sex).jpg]] | + | |'''tabstat factorA, by(sex)''' |
| + | [[file:tabstat_factorA_by(sex).jpg]] | ||
|rowspan="2"|Both reports mean<br> but '''summarize''' is more detailed;<br>needs '''bysort''' option before the command | |rowspan="2"|Both reports mean<br> but '''summarize''' is more detailed;<br>needs '''bysort''' option before the command | ||
|- | |- | ||
!summarize | !summarize | ||
| − | |[[file:summarize_factorA_bysort_sex.jpg]] | + | |'''bysort sex: summarize factorA''' |
| + | [[file:summarize_factorA_bysort_sex.jpg]] | ||
|} | |} | ||
| 191行目: | 201行目: | ||
|- | |- | ||
!table | !table | ||
| − | |[[file:table_factorA_sex.jpg]] | + | |'''table factorA sex''' |
| + | [[file:table_factorA_sex.jpg]] | ||
|rowspan="2"|Both creates the same table<br> but '''tabulate''' is better visualized | |rowspan="2"|Both creates the same table<br> but '''tabulate''' is better visualized | ||
|- | |- | ||
!tabulate | !tabulate | ||
| − | |[[file:tabulate_factorA_sex.jpg]] | + | |'''tabulate factorA sex''' |
| + | [[file:tabulate_factorA_sex.jpg]] | ||
|- | |- | ||
!tabstat | !tabstat | ||
| − | |[[file:tabstat_sex_by(factorA).jpg]] | + | |'''tabstat sex, by(factorA)''' |
| + | [[file:tabstat_sex_by(factorA).jpg]] | ||
|rowspan="2"|Both reports mean<br> but '''summarize''' is more detailed;<br>needs '''bysort''' option before the command | |rowspan="2"|Both reports mean<br> but '''summarize''' is more detailed;<br>needs '''bysort''' option before the command | ||
|- | |- | ||
!summarize | !summarize | ||
| − | |[[file:summarize_sex_bysort_factorA.jpg]] | + | |'''bysort factorA: summarize sex''' |
| + | [[file:summarize_sex_bysort_factorA.jpg]] | ||
|} | |} | ||
| 214行目: | 228行目: | ||
|- | |- | ||
!tabstat | !tabstat | ||
| − | |[[file:tabstat_data1_by(disease).jpg]] | + | |'''tabstat data, by(disease)''' |
| + | [[file:tabstat_data1_by(disease).jpg]] | ||
|rowspan="2"|Both reports mean<br> but '''summarize''' is more detailed;<br>needs '''bysort''' option before the command | |rowspan="2"|Both reports mean<br> but '''summarize''' is more detailed;<br>needs '''bysort''' option before the command | ||
|- | |- | ||
!summarize | !summarize | ||
| − | |[[file:summarize_data1_bysort_disease.jpg]] | + | |'''bysort disease: summarize data1''' |
| + | [[file:summarize_data1_bysort_disease.jpg]] | ||
|} | |} | ||
| 226行目: | 242行目: | ||
|- | |- | ||
!rowspan="3"|table | !rowspan="3"|table | ||
| − | |[[file:table_sex_factorA_statistic(percent).jpg]] | + | |'''table sex factorA, statistic(percent)''' |
| + | [[file:table_sex_factorA_statistic(percent).jpg]] | ||
|This calculates proportions of cells compared to the whole<br> without showing raw values | |This calculates proportions of cells compared to the whole<br> without showing raw values | ||
|- | |- | ||
| − | |[[file:table_sex_factorA_statistic(percent_across(sex)).jpg]] | + | |'''table sex factorA, statistic(percent, across(sex))''' |
| + | [[file:table_sex_factorA_statistic(percent_across(sex)).jpg]] | ||
|This calculates proportions in column (longitudinal) directions<br> without showing raw values | |This calculates proportions in column (longitudinal) directions<br> without showing raw values | ||
|- | |- | ||
| − | |[[file:table_sex_factorA_statistic(percent_across(factorA)).jpg]] | + | |'''tale sex factorA, statistic(percent, across(factorA))''' |
| + | [[file:table_sex_factorA_statistic(percent_across(factorA)).jpg]] | ||
|This calculates proportions in row (transverse) directions<br> without showing raw values | |This calculates proportions in row (transverse) directions<br> without showing raw values | ||
|- | |- | ||
!rowspan="2"|tabulate | !rowspan="2"|tabulate | ||
| − | |[[file:tabulate_sex_factorA_column.jpg]] | + | |'''tabulate sex factorA, column''' |
| + | [[file:tabulate_sex_factorA_column.jpg]] | ||
|This calculates proportions in column (longitudinal) directions | |This calculates proportions in column (longitudinal) directions | ||
|- | |- | ||
| − | |[[file:tabulate_sex_factorA_row.jpg]] | + | |'''tabulate sex factorA, row''' |
| + | [[file:tabulate_sex_factorA_row.jpg]] | ||
|This calculates proportions in row (transverse) directions | |This calculates proportions in row (transverse) directions | ||
|} | |} | ||
| 248行目: | 269行目: | ||
|- | |- | ||
!rowspan="3"|tabstat | !rowspan="3"|tabstat | ||
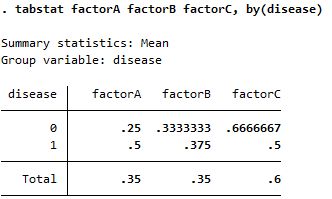
| − | |[[File:tabstat_factorABC_by(disease).jpg]] | + | |'''tabstat factorA factorB factorC, by(disease)''' |
| + | [[File:tabstat_factorABC_by(disease).jpg]] | ||
| | | | ||
|- | |- | ||
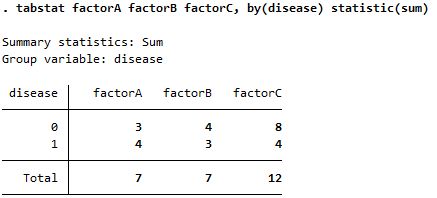
| − | |[[File:tabstat_factorABC_by(disease)_statistic(sum).jpg]] | + | |'''tabstat factorA factorB factorC, by(disease) statistic(sum)''' |
| + | [[File:tabstat_factorABC_by(disease)_statistic(sum).jpg]] | ||
|factorA,B,C are binary variables so summations of values provide the positivities of factorA,B,C | |factorA,B,C are binary variables so summations of values provide the positivities of factorA,B,C | ||
|- | |- | ||
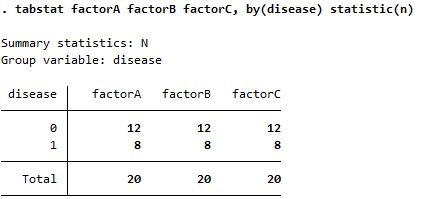
| − | |[[File:tabstat_factorABC_by(disease)_statistic(n).jpg]] | + | |'''tabstat factorA factorB factorC, by(disease) statistic(n)''' |
| + | [[File:tabstat_factorABC_by(disease)_statistic(n).jpg]] | ||
|''statistic(n)'' (''statistic(count)'' is the same) only counts observations with real values, which only tell non-missing observations | |''statistic(n)'' (''statistic(count)'' is the same) only counts observations with real values, which only tell non-missing observations | ||
|} | |} | ||
| 262行目: | 286行目: | ||
|- | |- | ||
!rowspan="3"|tabstat | !rowspan="3"|tabstat | ||
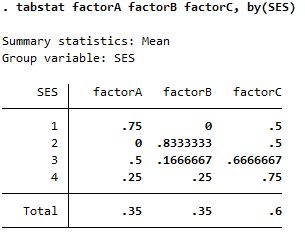
| − | |[[File:tabstat_factorABC_by(SES).jpg]] | + | |'''tabstat factorA factorB factorC, by(SES)''' |
| + | [[File:tabstat_factorABC_by(SES).jpg]] | ||
| | | | ||
|- | |- | ||
| − | |[[File:tabstat_factorABC_by(SES)_statistic(sum).jpg]] | + | |'''tabstat factorA factorB factorC, by(SES) statistic(sum)''' |
| + | [[File:tabstat_factorABC_by(SES)_statistic(sum).jpg]] | ||
|factorA,B,C are binary variables so summations of values provide the positivities of factorA,B,C | |factorA,B,C are binary variables so summations of values provide the positivities of factorA,B,C | ||
|- | |- | ||
| − | |[[File:tabstat_factorABC_by(SES)_statistic(n).jpg]] | + | |'''tabstat factorA factorB factorC, by(SES) statistic(n)''' |
| + | [[File:tabstat_factorABC_by(SES)_statistic(n).jpg]] | ||
|''statistic(n)'' (''statistic(count)'' is the same) only counts observations with real values, which only tell non-missing observations | |''statistic(n)'' (''statistic(count)'' is the same) only counts observations with real values, which only tell non-missing observations | ||
|} | |} | ||
| 277行目: | 304行目: | ||
|- | |- | ||
!tabulate | !tabulate | ||
| − | |[[File:tabulate_disease_SES_summarize(data1).jpg]] | + | |'''tabulate disease SES, summarize(data1)''' |
| + | [[File:tabulate_disease_SES_summarize(data1).jpg]] | ||
|This tells means, SDs and frequencies of a continuous variable divided in two-way of binary/categorical variables | |This tells means, SDs and frequencies of a continuous variable divided in two-way of binary/categorical variables | ||
|} | |} | ||
2023年4月2日 (日) 19:50時点における最新版
目次
Abbreviations of commands
| table | (no abbv.) |
|---|---|
| tabulate | ta tab |
| tabstat | (no abbv.) |
| summarize | su |
Differences between table, tabulate, tabstat, summarize
| one-way | two-way | options | |
|---|---|---|---|
| table | table v1 create a one-way table of v1 |
table v1 v2 create a two-way table of v1 |
,statistics( ) |
| tabulate | tabulate v1 create a one-way table of v1 |
tabulate v1 v2 create a two-way table with v1 |
,chi2 Pearson's chi-squared test; *only for two-way ,summarize(v3) detailed statistics for v3 |
| tabstat | tabstat v1 create a one-way table of v1 |
*no two- or multiple-way table | ,statistics( ) ,by(v3) detailed statistics for each of v3 |
| summarize | summarize v1 detailed statistics of v1 |
*no two- or multiple-way summary | ,detail |
† row = transverse direction, column = longitudinal direction
Sample data
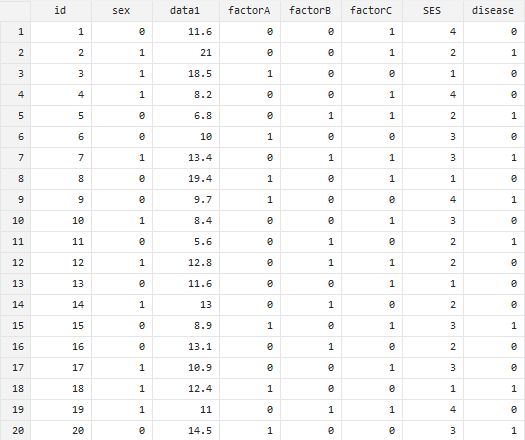
Suppose we have such a dataset in STATA.
Where,
| id | discrete | :Identification number |
|---|---|---|
| sex | binary | :Male=0, Female=1 |
| data1 | continuous | :Results of a certain test |
| factorA, B, C | binary | :Negative=0, Positive=1 |
| SES | categorical | :Categories of Socio-Economic Status, divided into four |
| disease | binary | :Free from a certain disease=0, Having the disease=1 |
One-way
Summary of sex, a binary variable
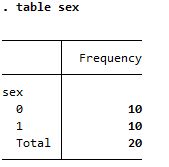
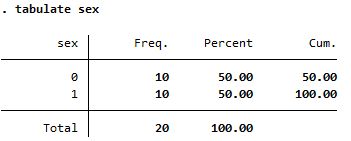
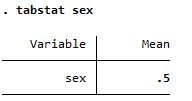
| table | table sex | Both reports frequency but tabulate is more detailed |
|---|---|---|
| tabulate | tabulate sex | |
| tabstat | tabstat sex | Both reports mean but summarize is more detailed |
| summarize | summarize sex |
Summary of data1, a continuous variable
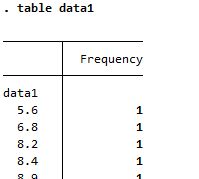
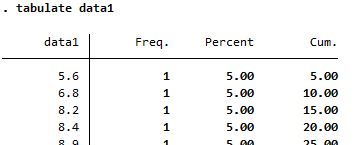
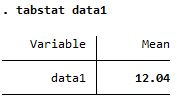
| table | table data1 | Both reports frequency of each value, which does not make sense |
|---|---|---|
| tabulate | tabulate data1 | |
| tabstat | tabstat data1 | Both reports mean but summarize is more detailed |
| summarize | summarize data1 |
Summary of SES, a categorical variable
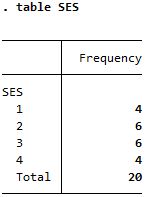
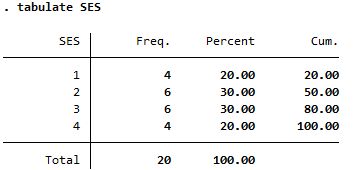
| table | table SES | Both reports frequency but tabulate is more detailed |
|---|---|---|
| tabulate | tabulate SES | |
| tabstat | tabstat SES | Both reports mean but summarize is more detailed |
| summarize | summarize SES |
One-way, multiple
| table | *Both do not create one-way multiple table | |
|---|---|---|
| tabulate | ||
| tabstat | tabstat sex data1 SES | Reports mean in row (transverse) direction |
| summarize | summarize sex data1 SES | Reports more details in column (longitudinal) direction |
Two-way
Summary of factorA based on sex
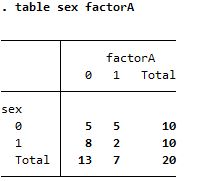
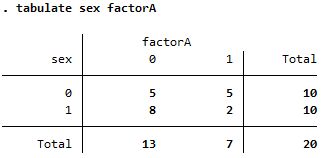
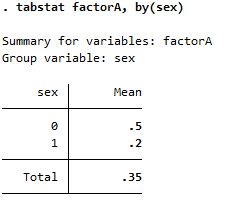
| table | table sex factorA | Both creates the same table but tabulate is better visualized |
|---|---|---|
| tabulate | tabulate sex factorA | |
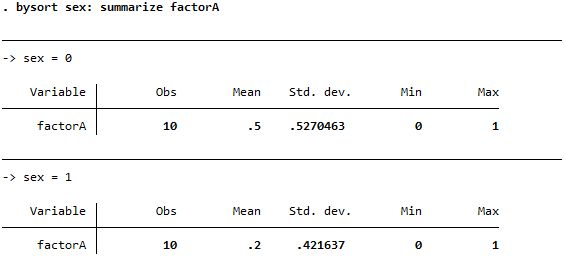
| tabstat | tabstat factorA, by(sex) | Both reports mean but summarize is more detailed; needs bysort option before the command |
| summarize | bysort sex: summarize factorA |
Summary of sex based on factorA
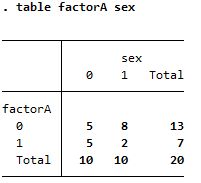
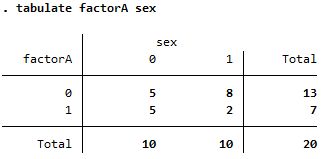
| table | table factorA sex | Both creates the same table but tabulate is better visualized |
|---|---|---|
| tabulate | tabulate factorA sex | |
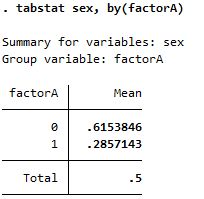
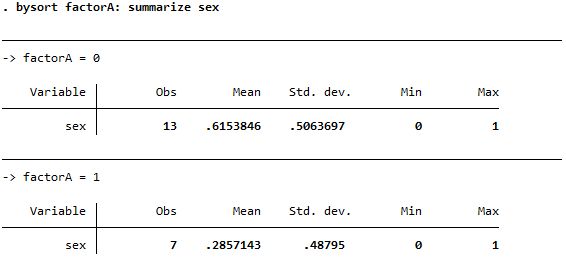
| tabstat | tabstat sex, by(factorA) | Both reports mean but summarize is more detailed; needs bysort option before the command |
| summarize | bysort factorA: summarize sex |
Summary of data1 based on disease
| table | *Both do not create a meaningful table for continuous variable | |
|---|---|---|
| tabulate | ||
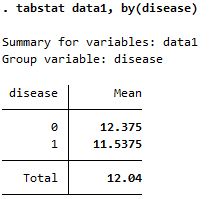
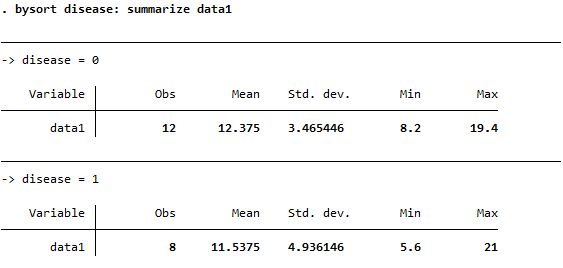
| tabstat | tabstat data, by(disease) | Both reports mean but summarize is more detailed; needs bysort option before the command |
| summarize | bysort disease: summarize data1 | |
Two-way with proportions
Summary of factorA based on sex with proportions
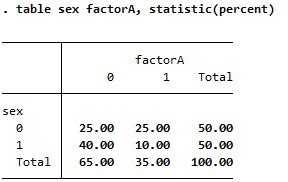
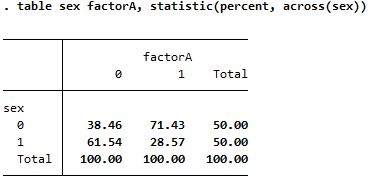
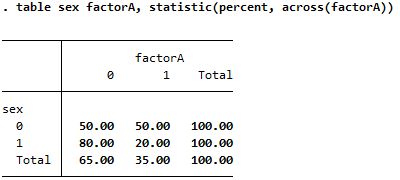
| table | table sex factorA, statistic(percent) | This calculates proportions of cells compared to the whole without showing raw values |
|---|---|---|
| table sex factorA, statistic(percent, across(sex)) | This calculates proportions in column (longitudinal) directions without showing raw values | |
| tale sex factorA, statistic(percent, across(factorA)) | This calculates proportions in row (transverse) directions without showing raw values | |
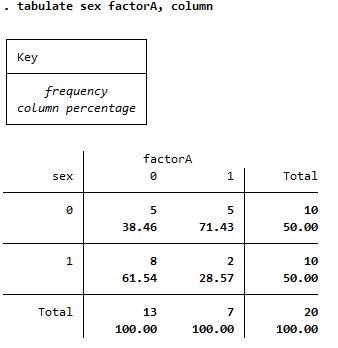
| tabulate | tabulate sex factorA, column | This calculates proportions in column (longitudinal) directions |
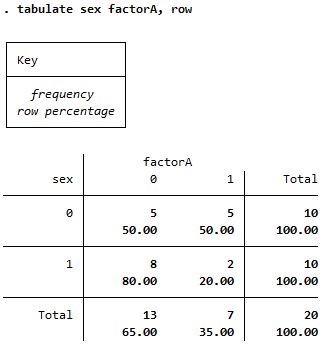
| tabulate sex factorA, row | This calculates proportions in row (transverse) directions |
Two-way, multiple
Summary of factorA, factorB, factorC based on disease
| tabstat | tabstat factorA factorB factorC, by(disease) | |
|---|---|---|
| tabstat factorA factorB factorC, by(disease) statistic(sum) | factorA,B,C are binary variables so summations of values provide the positivities of factorA,B,C | |
| tabstat factorA factorB factorC, by(disease) statistic(n) | statistic(n) (statistic(count) is the same) only counts observations with real values, which only tell non-missing observations |
Summary of factorA, factorB, factorC based on SES
| tabstat | tabstat factorA factorB factorC, by(SES) | |
|---|---|---|
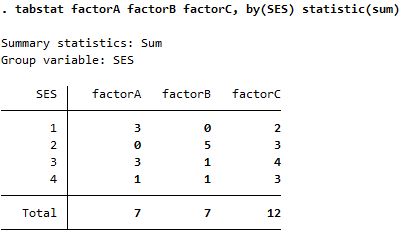
| tabstat factorA factorB factorC, by(SES) statistic(sum) | factorA,B,C are binary variables so summations of values provide the positivities of factorA,B,C | |
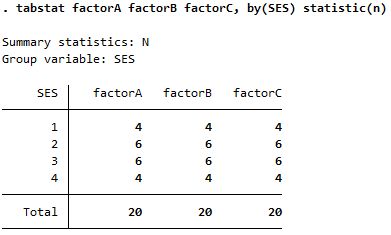
| tabstat factorA factorB factorC, by(SES) statistic(n) | statistic(n) (statistic(count) is the same) only counts observations with real values, which only tell non-missing observations |
Two-way of binary/categorical plus summary of continuous
Summary of data1 based on disease and SES
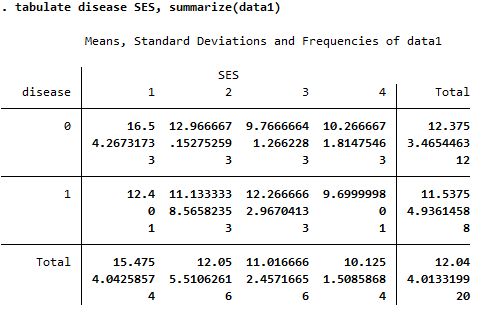
| tabulate | tabulate disease SES, summarize(data1) | This tells means, SDs and frequencies of a continuous variable divided in two-way of binary/categorical variables |
|---|
