「Epidemiology」の版間の差分
Vaccipedia.admin (トーク | 投稿記録) |
Vaccipedia.admin (トーク | 投稿記録) |
||
| 165行目: | 165行目: | ||
!=Reliability | !=Reliability | ||
|} | |} | ||
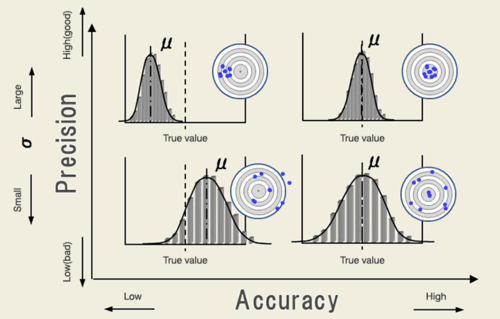
| − | [[File:Accuracy and Precision 2.gif|thumb|500px|Accuracy in <math>x</math>-axis, Precision in <math>y</math>-axis]] | + | [[File:Accuracy and Precision 2.gif|thumb|float|500px|Accuracy in <math>x</math>-axis, Precision in <math>y</math>-axis]] |
<nowiki>*</nowiki>In this example, μ is sample mean, not the population mean | <nowiki>*</nowiki>In this example, μ is sample mean, not the population mean | ||
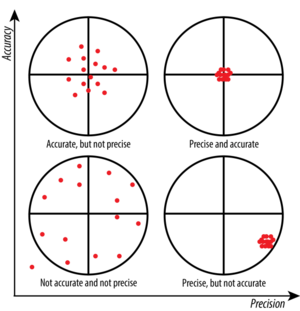
| − | [[File:Accuracy and Precision 1.webp|thumb | + | [[File:Accuracy and Precision 1.webp|thumb|300px|Precision in <math>x</math>-axis, Accuracy in <math>y</math>-axis]] |
<p style="clear:both;"> | <p style="clear:both;"> | ||
2023年2月17日 (金) 12:31時点における版
目次
Disease frequency measurement
Bradford Hill Criteria for assuming causality
| In terms of the association between exposure and outcome, exposure is more likely to be causal if .... | |
|---|---|
| 1. Strength of association | the stronger the association is. |
| 2. Consistency | in the more varieties settings the association is observed. |
| 3. Specificity | the more specific the exposure is, i.e., the exposure is associated with only single outcome. |
| 4. Temporality | the exposure comes first and the outcome appears after the exposure |
| 5. Biological gradient | the more (or less) exposure is associated with more frequent outcome (exposure dose dependent). |
| 6. Plausibility | the mechanism between the exposure and the outcome can be explained according to biological body of knowledge. |
| 7. Coherence | the mechanism between the exposure and the outcome can be proven by certain medical testings. |
| 8. Experiment | some intervention to the exposure can change frequency and/or extent of the outcome. |
| 9. Analogy | another similar exposure is associated with another similar outcome. |
Classification of Bias
| Major classification | Specific name | Description | Affecting design | |
|---|---|---|---|---|
| Selection bias | Sample is not properly representative of population | Ascertainment bias | Inappropriate definition of population | Any observational design |
| Healthy worker effect | Current employees are more likely to be healthy than general population and ex-employees | Cohort, esp. historical | ||
| Detection bias | Diagnostic procedures are different between case and control | Case-control | ||
| Attrition bias (Loss to follow-up) |
needless to explain | Cohort Clinical trial | ||
| Non-response bias | a.k.a. Healthy volunteer effect; Voluntary participants are not representative of population | Any observational design | ||
| Language bias | Medical articles written in languages unfamiliar to researchers are more likely to be ignored | Meta-analysis Systematic review | ||
| Publication bias | Researches with negative results are more likely to be unpublished | Meta-analysis Systematic review | ||
| Information bias (Measurement bias) |
Observation is not properly conducted | Non-differential misclassification bias | Failure to properly measure exposure/outcome and inappropriate allocations of groups in the same weight for both
|
Any design |
| Differential misclassification bias | Failure to properly measure exposure/outcome and inappropriate allocations of groups in different weights in-between
|
Any design | ||
|
|
Any design | ||
|
|
Any design | ||
| Observer/interviewer bias | Observers/interviewers are more likely to observe/draw interviews toward exposure according to case outcome status | Any design | ||
| Ecological fallacy | Ecological design | |||
| Regression to the mean | Extreme observations in initial investigations will be toward true population value in later investigations | Cohort Clinical trial | ||
| Hawthorne effect | Observation itself can affect outcome | Clinical trial | ||
| Lead-time bias | Screening trial can diagnose outcome even in its earlier latent period which fallaciously show longer survival | Screening trial | ||
| Confounding | Third factors affect both of exposure and outcome |
Confounding may occur even in RCT if randomization process is inappropriate (as systematic error) or randomly allocated groups are heterogenous by chance (as random error) | ||
Difference between Population and Sample
Accuracy and Precision
| Accuracy |
|
=Validity |
|---|---|---|
| Precision |
|
=Reliability |
*In this example, μ is sample mean, not the population mean
Tips in Case-control design
Sampling (selection bias)
| Case sampling | Control sampling |
|---|---|
|
|
|
|
|
|
| |
| |
Measurement (Information bias)
| Observer bias |
|
|---|---|
| Recall bias |
|
Confounding and Effect modification
Sampling
Simple random sampling (SRS)
Standard Error with Finite Population Correction in SRS
The formula [math]\displaystyle{ SE = \frac{\sigma}{\sqrt{N}} }[/math] assume that samples are selected from infinite population with replacement (allowing repetitive sampling of the same individuals).
In reality, sampling is made from finite population without replacement (not allowing repetitive sampling of the same individuals).
When sampling from finite population without replacement, if fraction [math]\displaystyle{ \frac{n}{N} }[/math] > 5% (0.05), [math]\displaystyle{ SE }[/math] will be too large.
Repeating sampling from finite population of size of [math]\displaystyle{ N }[/math] by sample size of [math]\displaystyle{ n_i }[/math] decreases population size at every sampling:
population size at [math]\displaystyle{ m }[/math]th sampling = [math]\displaystyle{ N - \sum_{i=1}^m {n_i} }[/math]
If the fraction [math]\displaystyle{ \frac{n}{N} }[/math] > 5% (0.05), [math]\displaystyle{ SE }[/math] should be corrected by Finite Population Correction.
| Standard Error corrected by Finite Population Correction when [math]\displaystyle{ \frac{n}{N} }[/math] > 5% (0.05) |
|---|
| [math]\displaystyle{ Finite\ Population\ Correction\ (FPC) = \sqrt{\frac{N-n}{N-1}} }[/math] |
| [math]\displaystyle{ Corrected\ SE = FPC \times SE = \sqrt{\frac{N-n}{N-1}} \cdot \frac{\sigma}{\sqrt{N}} }[/math] |
Two-stage (multi-stage) sampling
In case of two-stage sampling:
- Randomly sample primary sampling units (PSUs) (clusters) with probability proportional to size (PPS)
- larger size of PSUs (clusters) are more likely to be selected
- Randomly sample second-stage units (SSUs) (individuals) with the same number of individuals within PSUs (clusters)
- individuals in smaller size of PSUs are more likely to be selected
- final individual probability to be sampled is equivalent in entire population because of balancing probabilities between PSUs and SSUs
Stratified random sampling
To increase precision of estimates in heterogeneous groups in sample, separated (stratified) random sampling from each group in population can be chosen.
In stratified random sampling, sampling fractions in strata can be varied, e.g., sample size of minority groups can be larger than majority groups.

