「Epidemiology」の版間の差分
ナビゲーションに移動
検索に移動
Vaccipedia.admin (トーク | 投稿記録) (ページの作成:「==Self-assessment quiz== *[https://www.cdc.gov/csels/dsepd/ss1978/index.html CDC Principles of Epidemiology] *[https://www.med.soton.ac.uk/stats_eLearning/quizzes/index.h…」) |
Vaccipedia.admin (トーク | 投稿記録) |
||
| 235行目: | 235行目: | ||
*To mask research question/hypothesis to participants | *To mask research question/hypothesis to participants | ||
|} | |} | ||
| + | |||
| + | ==Confounding and Effect modification== | ||
| + | {{#mermaid: | ||
| + | flowchart TD | ||
| + | crude[Crude analysis] --> strata[Stratified analysis] | ||
| + | strata --> node1[[Are stratified estimates similar to each other?]] | ||
| + | node1 -- "YES, similar to each other" --> MH[Mantel-Haenszel adjusted analysis] | ||
| + | MH --> node2[[Is MH adjusted estimate similar to crude estimate?]] | ||
| + | node2 -- "YES, similar to crude" --> No([There is no Confounding nor Effect modification]) --> R1["Report crude (MH adjusted) estimate"] | ||
| + | node2 -- "NO, different from crude" --> Co([There is Confounding]) --> R2[Report MH adjusted estimate] | ||
| + | node1 -- "NO, different from each other" ----> EM([There is Effect modification]) --> R3[Report stratified estimates] | ||
| + | R2 -.-> node3[[Are all possible confounders measured<br>and all possible stratification conducted?]] | ||
| + | node3 -- "YES, rigorous" --> noR([MH adjusted estimate should be<br>closer to the true population value]) | ||
| + | node3 -- "NO, unfeasible" --> yesR([MH adjusted estimate should<br>still include residual confounding]) | ||
| + | }} | ||
2022年12月11日 (日) 18:02時点における版
目次
Self-assessment quiz
Disease frequency measurement
Bradford Hill Criteria for assuming causality
| In terms of the association between exposure and outcome, exposure is more likely to be causal if .... | |
|---|---|
| 1. Strength of association | the stronger the association is. |
| 2. Consistency | in the more varieties settings the association is observed. |
| 3. Specificity | the more specific the exposure is, i.e., the exposure is associated with only single outcome. |
| 4. Temporality | the exposure comes first and the outcome appears after the exposure |
| 5. Biological gradient | the more (or less) exposure is associated with more frequent outcome (exposure dose dependent). |
| 6. Plausibility | the mechanism between the exposure and the outcome can be explained according to biological body of knowledge. |
| 7. Coherence | the mechanism between the exposure and the outcome can be proven by certain medical testings. |
| 8. Experiment | some intervention to the exposure can change frequency and/or extent of the outcome. |
| 9. Analogy | another similar exposure is associated with another similar outcome. |
Classification of Bias
| Major classification | Specific name | Description | Affecting design | |
|---|---|---|---|---|
| Selection bias | Sample is not properly representative of population | Ascertainment bias | Inappropriate definition of population | Any observational design |
| Healthy worker effect | Current employees are more likely to be healthy than general population and ex-employees | Cohort, esp. historical | ||
| Detection bias | Diagnostic procedures are different between case and control | Case-control | ||
| Attrition bias (Loss to follow-up) |
needless to explain | Cohort Clinical trial | ||
| Non-response bias | a.k.a. Healthy volunteer effect; Voluntary participants are not representative of population | Any observational design | ||
| Language bias | Medical articles written in languages unfamiliar to researchers are more likely to be ignored | Meta-analysis Systematic review | ||
| Publication bias | Researches with negative results are more likely to be unpublished | Meta-analysis Systematic review | ||
| Information bias (Measurement bias) |
Observation is not properly conducted | Non-differential misclassification bias | Failure to properly measure exposure/outcome and inappropriate allocations of groups in the same weight for both
|
Any design |
| Differential misclassification bias | Failure to properly measure exposure/outcome and inappropriate allocations of groups in different weights in-between
|
Any design | ||
|
|
Any design | ||
|
|
Any design | ||
| Observer/interviewer bias | Observers/interviewers are more likely to observe/draw interviews toward exposure according to case outcome status | Any design | ||
| Ecological fallacy | Ecological design | |||
| Regression to the mean | Extreme observations in initial investigations will be toward true population value in later investigations | Cohort Clinical trial | ||
| Hawthorne effect | Observation itself can affect outcome | Clinical trial | ||
| Lead-time bias | Screening trial can diagnose outcome even in its earlier latent period which fallaciously show longer survival | Screening trial | ||
| Confounding | Third factors affect both of exposure and outcome |
Confounding may occur even in RCT if randomization process is inappropriate (as systematic error) or randomly allocated groups are heterogenous by chance (as random error) | ||
Difference between Population and Sample
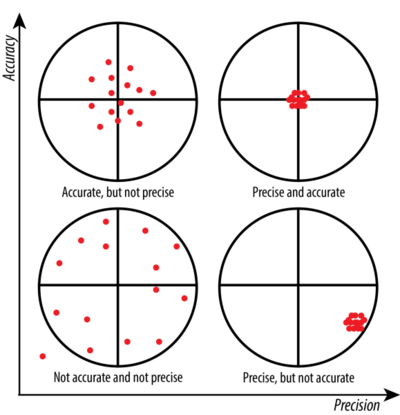
Accuracy and Precision
| Accuracy |
|
|---|---|
| Precision |
|

Accuracy in [math]\displaystyle{ x }[/math]-axis, Precision in [math]\displaystyle{ y }[/math]-axis
*In this example, μ is sample mean, not the population mean

Precision in [math]\displaystyle{ x }[/math]-axis, Accuracy in [math]\displaystyle{ y }[/math]-axis
Tips in Case-control design
Sampling (selection bias)
| Case sampling | Control sampling |
|---|---|
|
|
|
|
|
|
| |
| |
Measurement (Information bias)
| Observer bias |
|
|---|---|
| Recall bias |
|